Accountant handoff
See what you can send your accountant
Explore the sample accountant handoff workbook, with categorised transactions, monthly summaries and review flags in one Excel file. The sample uses fictitious Paperbark Studio records for 2025–26. It contains 27 sheets and 257 transactions across all 12 months; four transactions are retained for review but excluded from financial totals.
Windows 10 or later, x64. The 30-day Sole Trader trial starts in the app. No card required. Current imports use QIF bank exports.
View the workbook previewsWhat your accountant receives
- Inspect the summary: see the period, totals and review flags.
- Review transaction detail: trace amounts to categories and source records.
- See monthly profit and loss: actual categorised transactions, not forecasts.
How to inspect the sample workbook
Start with the Summary sheet and confirm the reporting period. Inspect the transaction detail, then review monthly profit and loss. Keep the review flags and source records close, and read the current export limitations before relying on the figures.
View the workbook previewsSample workbook preview
Synthetic sample data. This workbook demonstrates the export structure and does not establish that real records are complete or correct.
Sample generated outside Windows using unchanged 2026.242.634 export code and synthetic inputs.
Summary
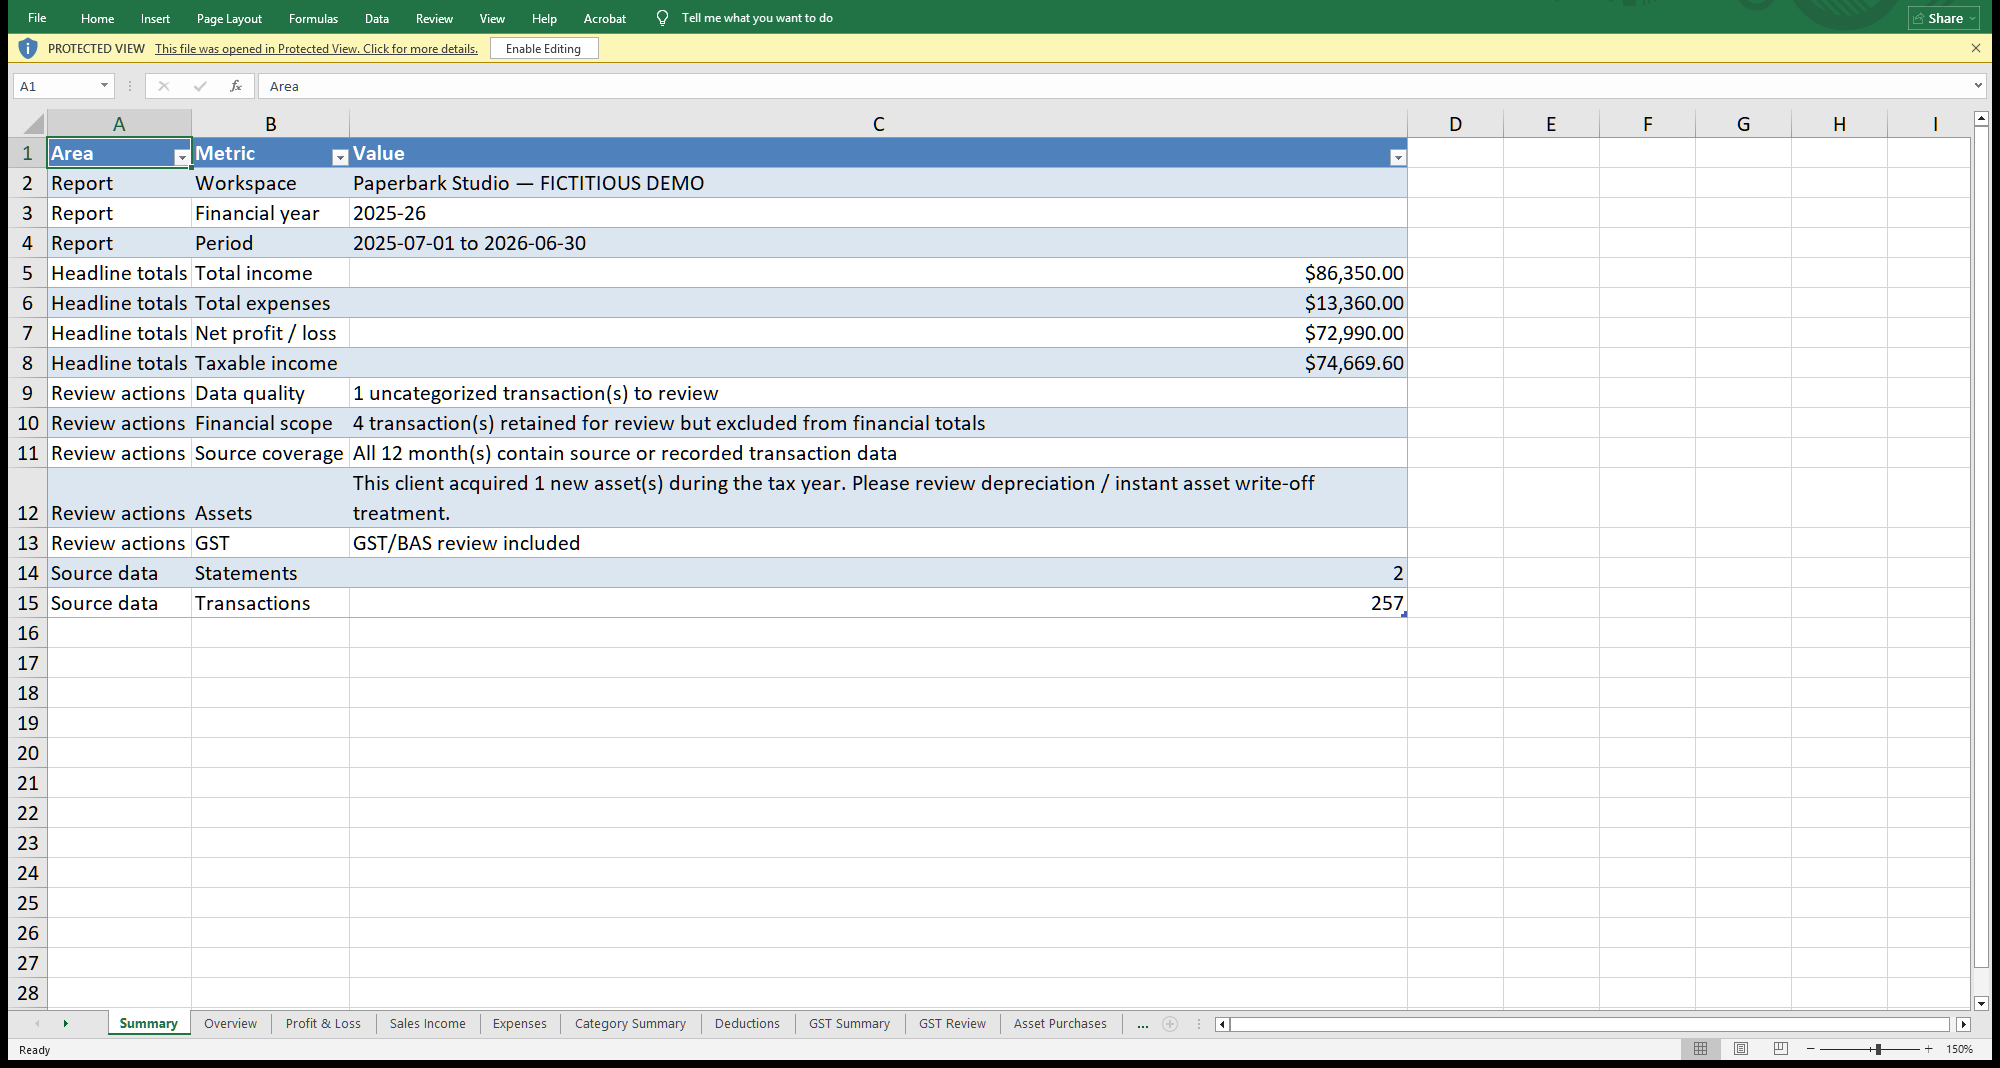 Open original Summary screenshot (new tab)
Transactions
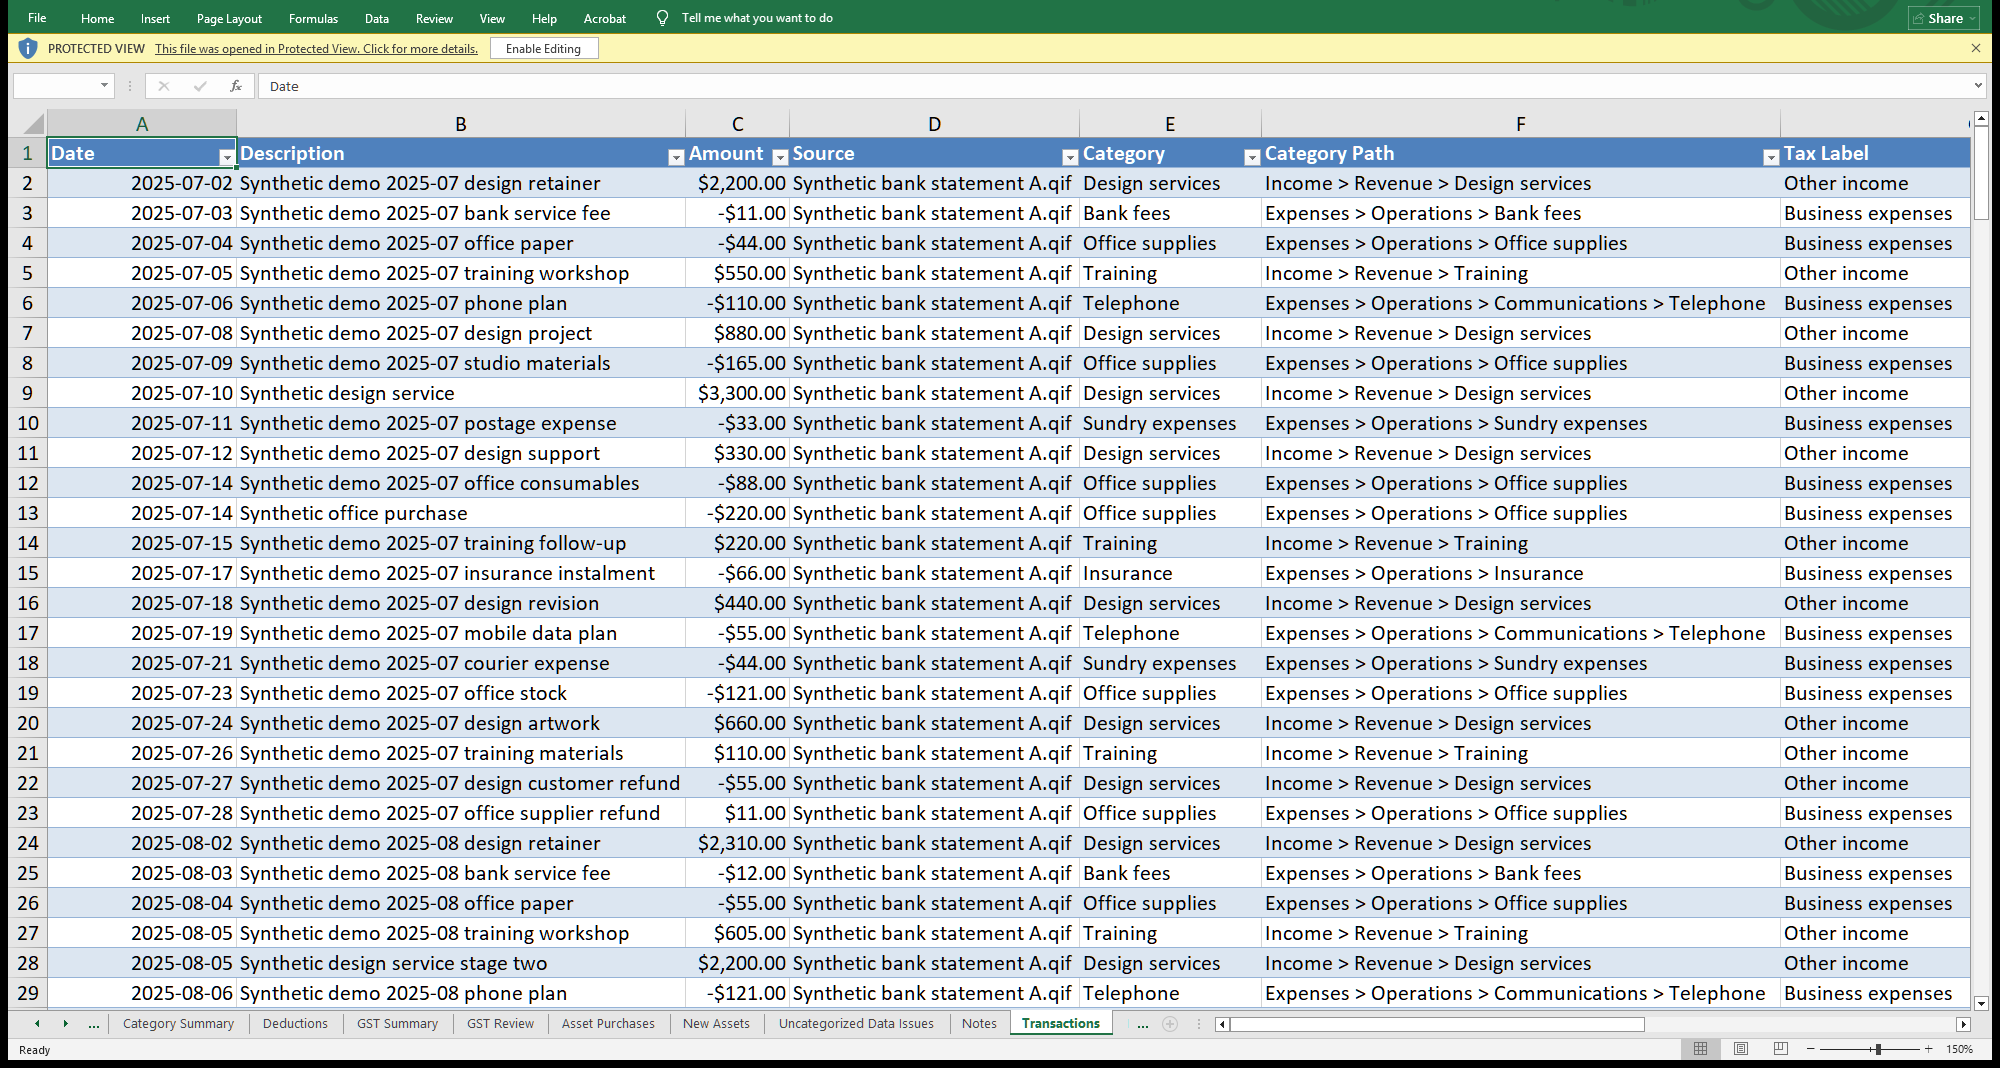 Open original Transactions screenshot (new tab)
Monthly Profit & Loss
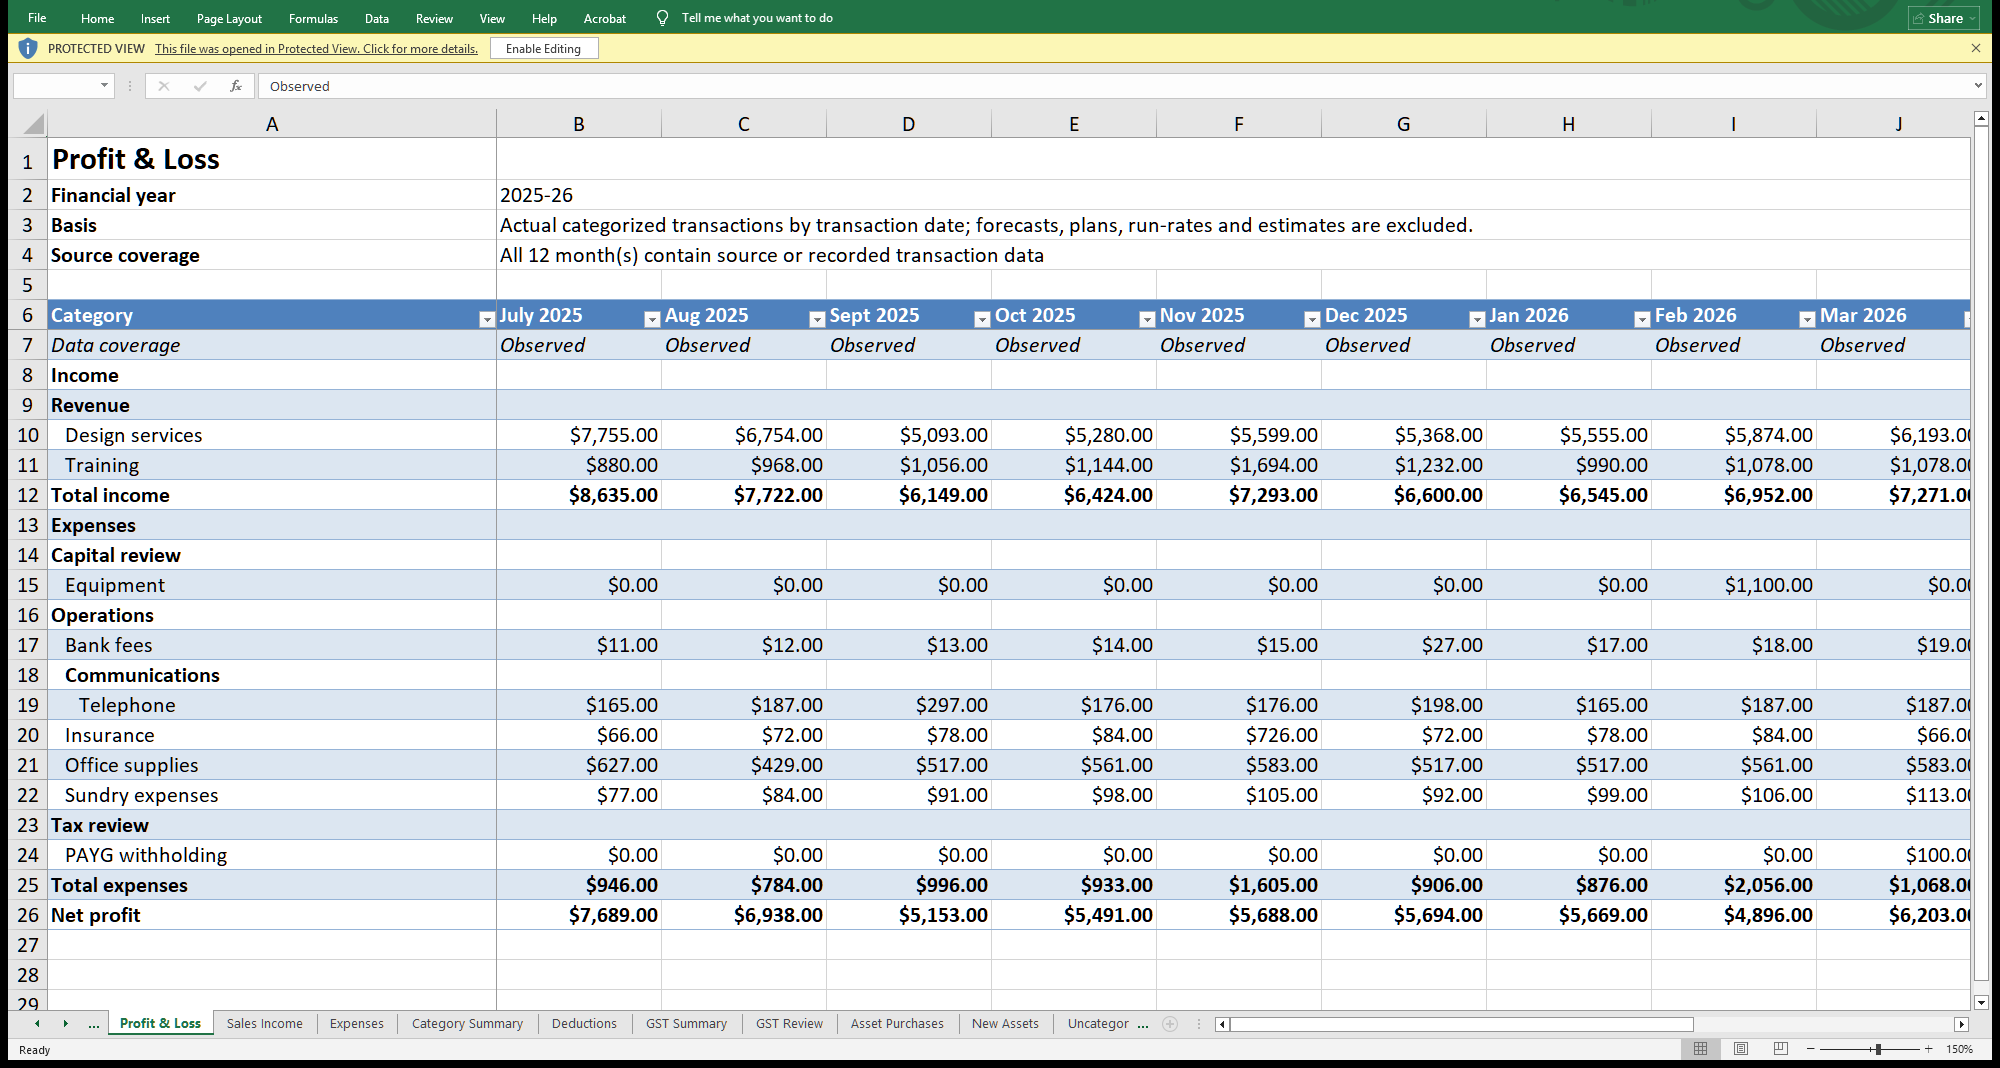 Open original Monthly Profit & Loss screenshot (new tab)
By Tax Tidy Published Last reviewed
See if it fits your workflow
Tax Tidy is Windows software for organising Australian business records and preparing material for accountant review. The current release imports QIF bank exports. It does not lodge your BAS or tax return.